Having low eCommerce conversion rates can be frustrating especially if you don’t know why. That’s where the power of heat maps comes in.
There are many reasons why your store isn’t seeing higher conversion rates, here are a couple:
- CTA buttons not clearly visible
- Distracting design and/or content
- Complicated or long checkout form
- Confusing conversion path
- Too much content
So how do you know which one is causing you issues? Heatmaps.
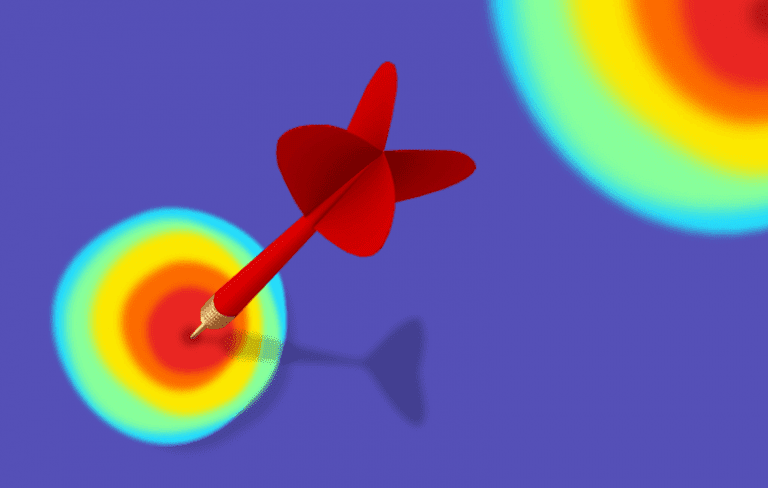
What is a heatmap?
It is a visual representation of all your website activity. These are the types of heatmaps:
- Click – Shows where users are clicking
- Attention/hover – Shows where users are hovering
- Scroll – Shows how far users scroll and how long they stay on sections
- Eye-tracking – Shows where users are looking
- Screen recording – Records whole sessions to see how users interact with your site
They will each show different statistics for the usage of your site, all of which can help you improve your pages and sales funnel. In the rest of this post, we will explore the four best ways a heatmap can help you increase conversions.
Analyze activity before purchase
Look at sessions where users converted and see if the process was seamless. Take note anytime they hover or have dead clicks these are areas you can improve. You can also look at sessions where users got close to converting but didn’t, and find out what actions they took that led them to leave. Here are a couple of things you should look out for:
- Lots of dead clicks (Clicking on non-clickable objects)
- Rage clicks (Repeatedly clicking an object, clickable or not)
- Hovering before clicking (The user could be confused)
- Not scrolling to the CTA (The user never even sees it)
- Irrelevant elements being clicked/hovered on (User gets taken off the path to conversion)
- Clicking back from the checkout page
To optimize your website for any of these don’t just change the whole site. Rather run an A/B split test and see which performs better.
Optimize website
Your page space utilization needs to be optimized. Focus on areas that are showing high impressions in your heat map and areas that have the highest bounce rate.
- The scroll map and hover map will show you where you should place your CTAs; should they go above or below the fold?
- The hover map will show exactly where users spend the most time; place your CTAs around this area.
- The scroll map will also show you where users are falling off identifying disengaging parts of your site.
Remove elements that are not attracting attention and replace them with better content. Likewise remove any elements that are taking attention away from the elements you want all eyes on, such as your CTA. Again running A/B split tests will help evaluate the success of your changes.
Identify non-converting CTAs
CTAs are key in eCommerce. Your users need a clear direction to convert. Look for the following when analyzing your heatmaps:
- Use the scroll map to see whether users see a clear CTA before drop off
- Use the click map to see if users are experiencing dead clicks on what they think is the CTA
- Use hover maps to see if users are hovering around the CTA
Your site should have multiple CTAs but if the CTA isn’t getting any love then keeping it is just a waste of space. Move them around and see what position works best with A/B split testing.
Simplify Checkout
The last step of the funnel. Arguably the most important step. If your checkout is too long or too complicated users will drop off and it really is a shame losing users in the final step. So make sure your checkout page is a tip-top and seamless experience. Using the hover map and session recordings you can see what part of the checkout gets users confused and pauses them from completing it. Do they drop off when selecting shipping, payment method, or entering their information? Analyze each of these steps in the hover map and find areas you can improve and speed up.
We recommend using Crazy Egg for your heatmap solutions.
Need help analyzing your heatmaps? Schedule a consultation below.